Infographics

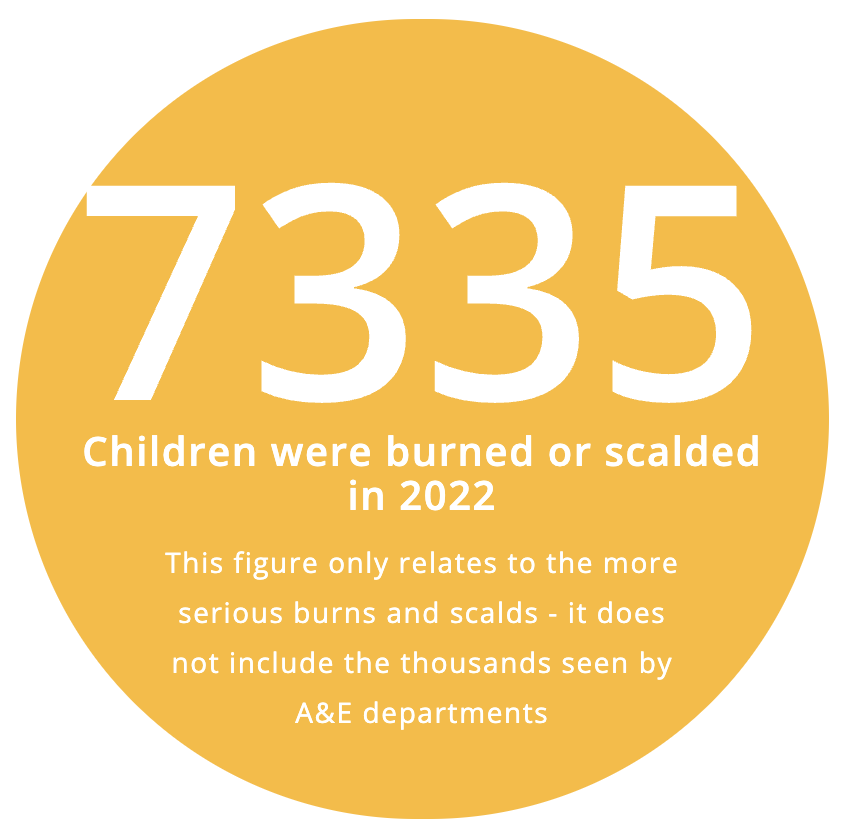
Our infographics show the number of burns and scalds that happened to children each month, broken down by age and geographical location.
It also highlights the top sources of burns and the places in and around the home burns and scalds occur.
Related content

Campaigns
We are involved in numerous prevention campaigns in order to reduce the number of children being burnt and scalded in the UK. Please share our campaigns to help raise even more awareness.
read more

Get involved
We receive no government funding and are only able to continue the work we do as a result of our own fundraising efforts.
read more
