Infographics

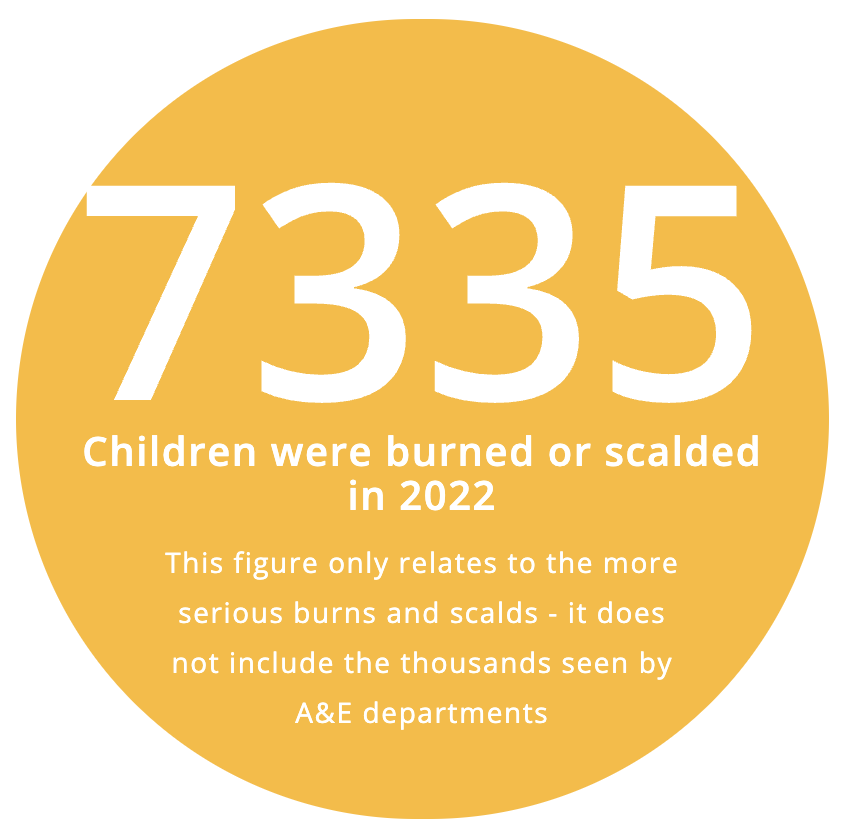
Our infographics show the number of burns and scalds that happened to children each month, broken down by age and geographical location.
It also highlights the top sources of burns and the places in and around the home burns and scalds occur.


